Introducing Sheet2Timeline
Creating a timeline or a gantt chart might be a challenging task; defining timeframe, blocks, dependencies, owners, making sure no "double booking", buffers and the list goes on. But what's more challenging is maintaining this chart overtime.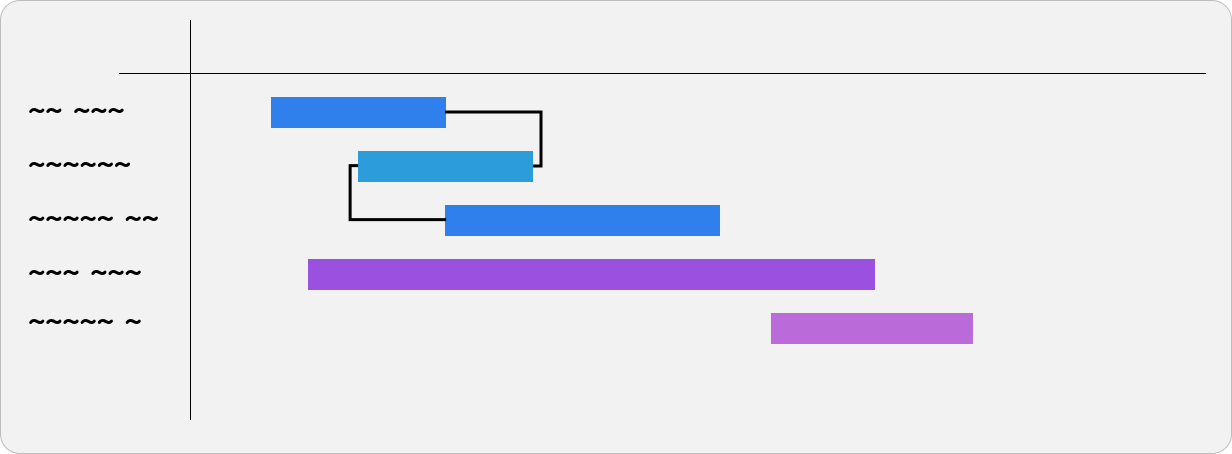
I've been there, tried all. Starting from Microsoft Project, through TeamGantt, Jira, Notion, Monday, ClickUp and more. My lowest was manually dragging lines in Google Slides... I wasn't happy with non of those. Each had a certain constraint that made the experience or the result insufficient.
Here is what was important for me:
- Collaboration - Allow other members to view and update timeline items
- Readability - Should be clear and "tell the story" and allow effective communication
- Single-Source-of-Truth - Avoid maintaining same content in multiple platforms
- Easy to maintain - Rearranging and changing items shouldn't be hell
At some point I decided that I'm going to manage the projects' dates in a spreadsheet, collaborate with my peers over it and present statuses as showing bare dates. It is then when it stroke me. I already have all the date, functions and calculations in a spreadsheet, wouldn't it make sense to be able to generate a timeline out of this data as simply as I can generate a simple Pie Chart?
Meet Sheet2Timeline
A tool that generates timeline/gantt chart out of your spreadsheet data, just as you would with Pie Chart (almost). You bring and keep the data, the tool only generates the visuals.
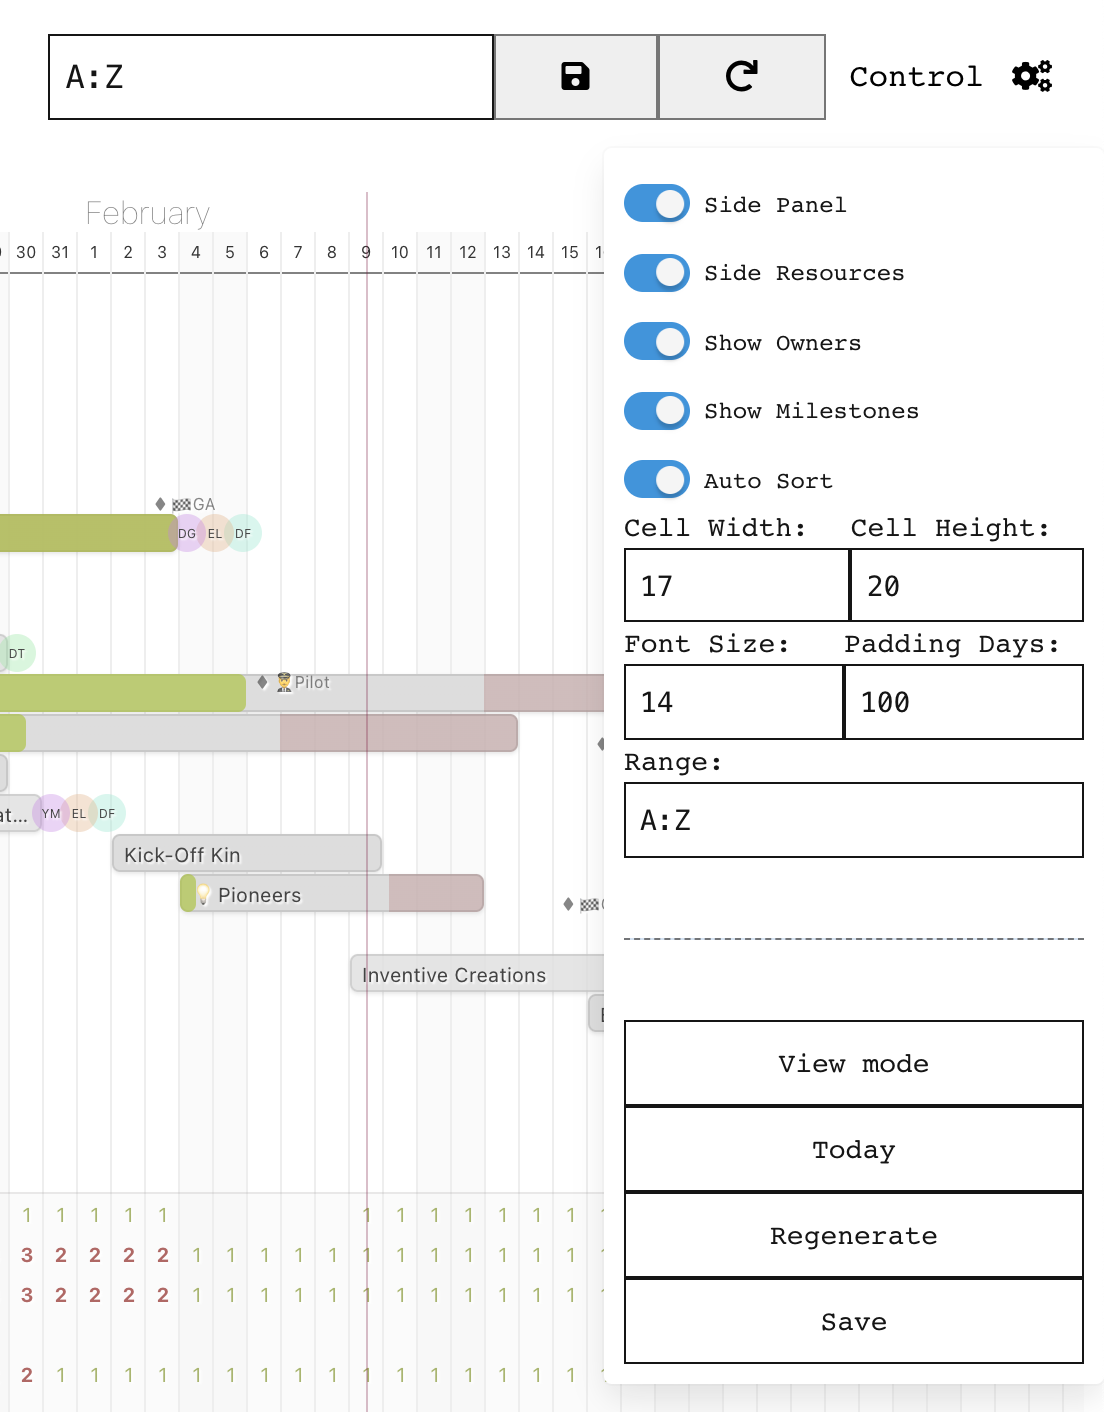
To help you achieve smooth efficiency the tool allows you making changes visually and persist the changes back to the spreadsheet.
- Bring-Your-Own-Data:
Timeline elements are actually rows and columns in your Google Sheet document - Readable:
Optimized for high overview message delivery; what’s the plan, where we at and what’s next - Keep-It-Simple:
Force to focus on specific level of details
Why Timeline?
One Timeline worth thousands status emails / meetings
- External tools such as TeamGantt, Notion, MS Project, etc, are ‘External’.
This requires maintaining multiple places to represent same truth.
It is hard to maintain for the long run. - Different tools look differently and practically are hard to read and consume the information effectively
- Those tools are too flexible and promote their users to either create timelines that are too much detailed or too vague
- Effective communication is such that one can easily get the message across with minimal effort and is self-serviced
Features:
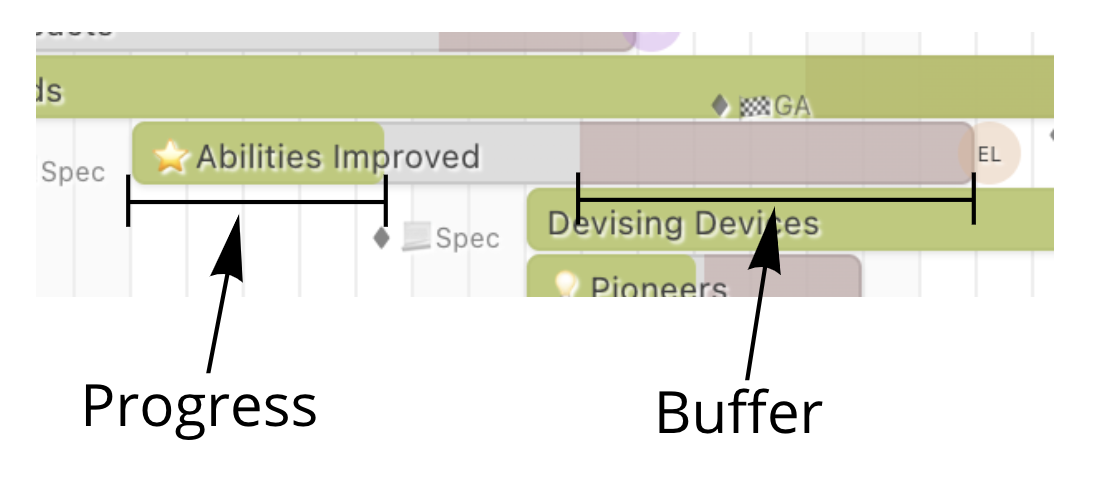
Initiatives Indicators:
- See visually & clearly the progress per initiative and the portion considered as buffer
- Identify buffer breach
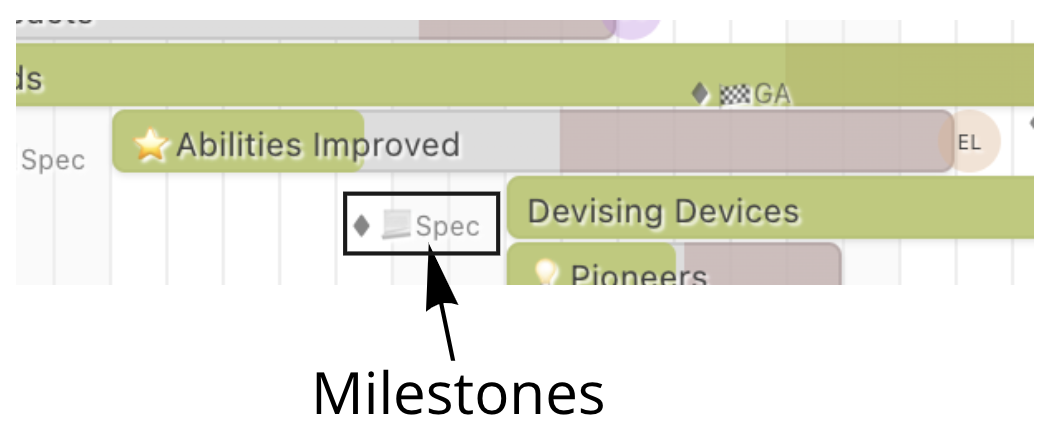
- Visualize important milestones per initiative, such as rollouts, spec readiness and more (fully customizable)
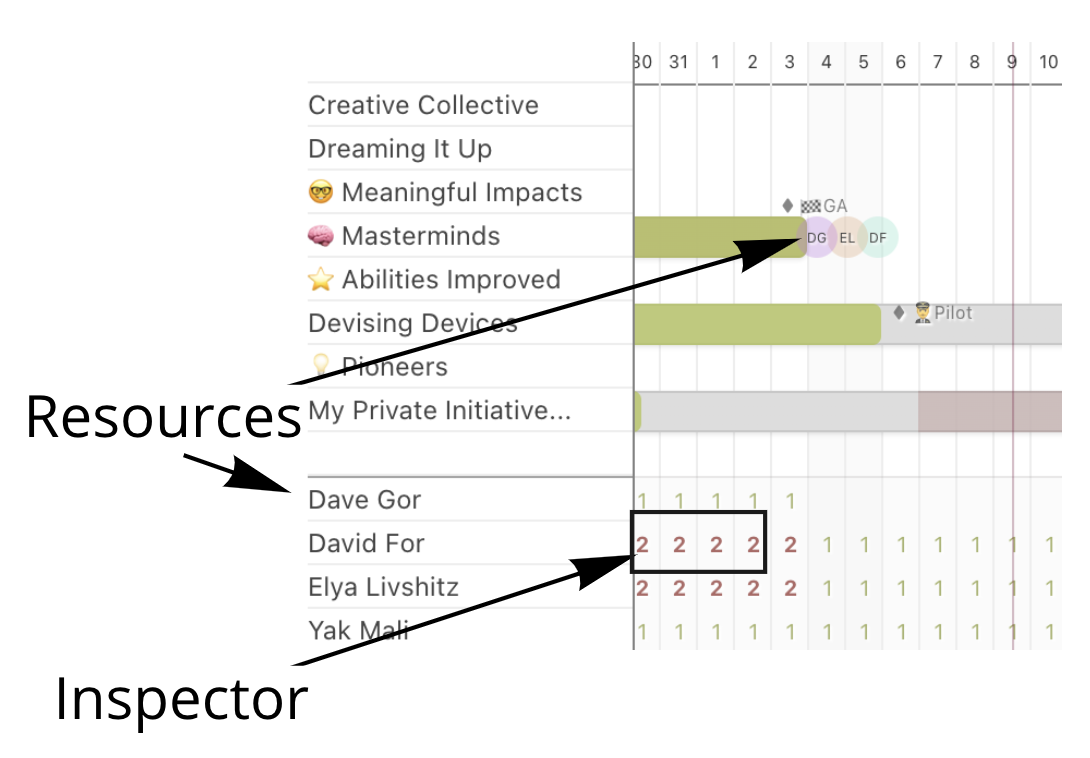
Assignees / Resources:
- See multiple assignees per initiative
- Use Resources Inspector to verify optimal utilization of resources and identify ‘double booking’
Persistence:
- Make changes right from the timeline tool and save back to the spreadsheet
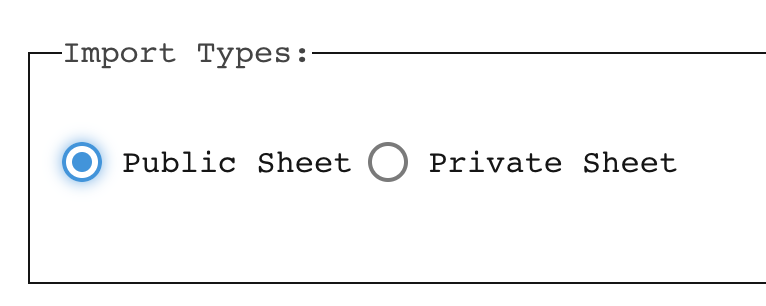
- Access your spreadsheets either for publicly accessible documents or private (requires Google Authentication):
Customizations:
- Fully customize and change the look & feel of the timeline elements, size and more
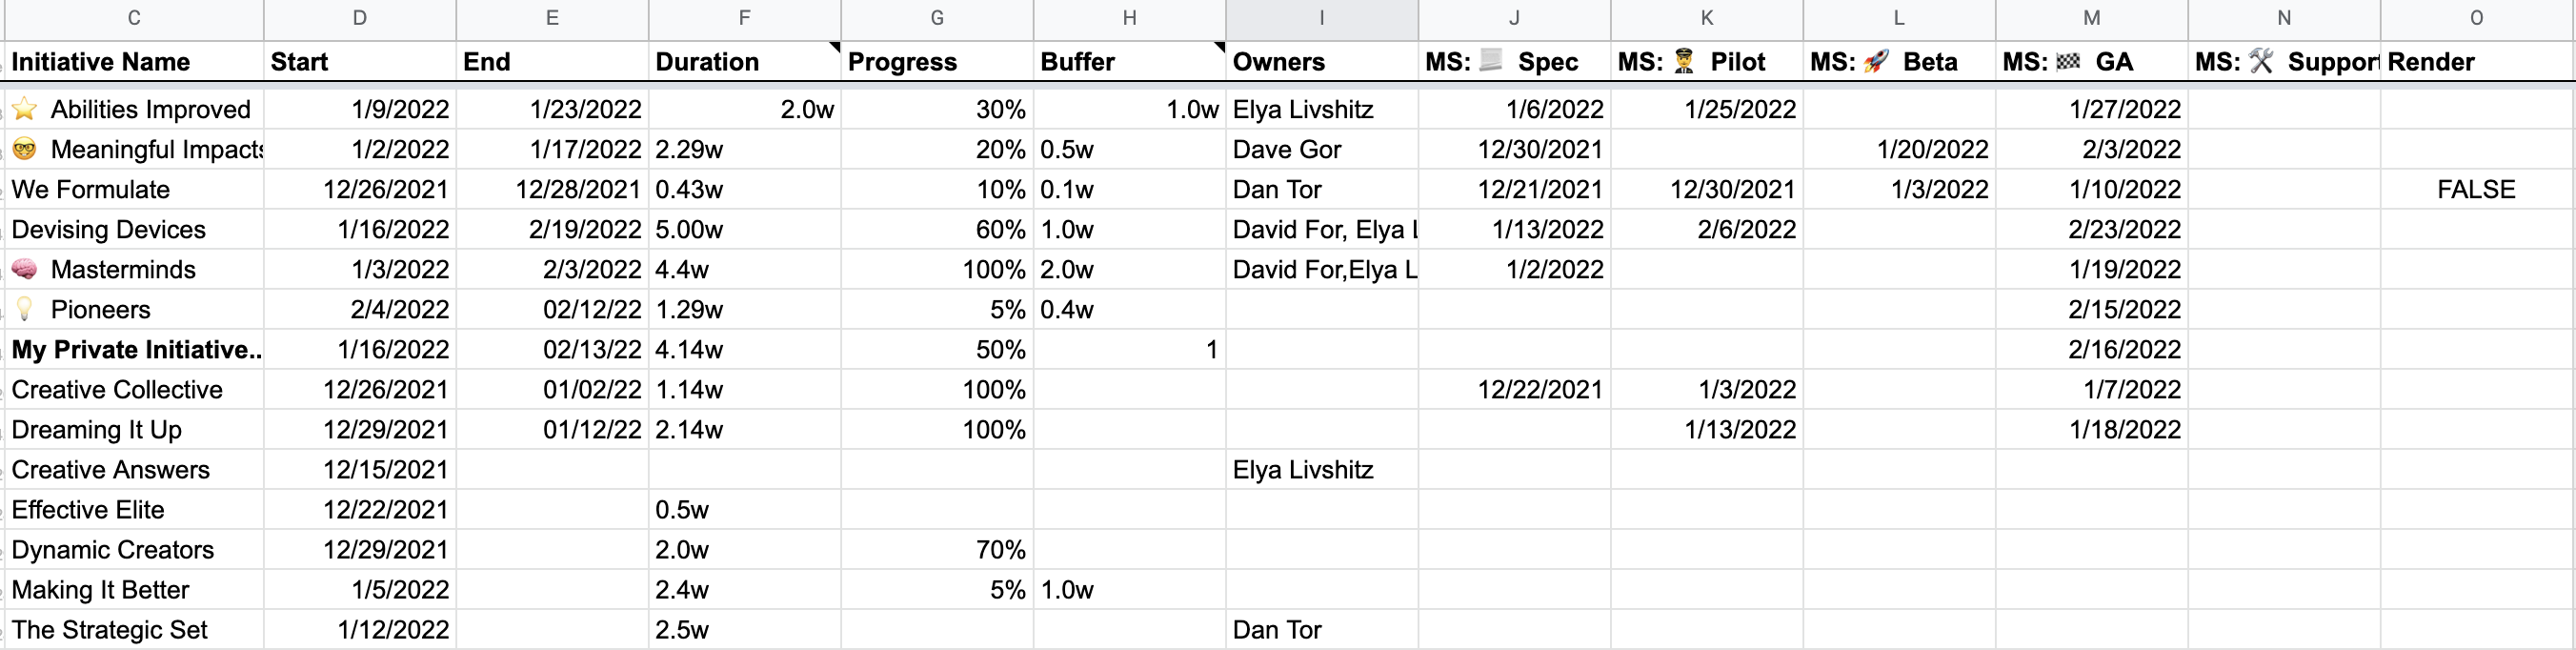
Spreadsheet as DB:
- Full control over the initiatives, dates, durations, etc, from within the spreadsheet.
- Add milestone types dynamically by adding a new column with “MS: “ prefix
- Control the ordering or hiding via ‘Render’ column
Get It:
Visit https://liv.tools/utilities/timeline to get more info. Please note that the utility is still in limited Beta, drop your email here and you'll get update once it's publicly available or join as a Beta tester.